
By Airon Rodrigues
One of the most important activities to undertake when building a webpage is to test. Testing what works, and what doesn’t.
How do we know if something will work at a first attempt? Will my new CTA button work when placed directly under my headline? Or should I instead make the CTA button smaller and reposition it? The answer to these questions is that you can never be sure.
When testing what works and what doesn’t, we have a clear direction of where a design, layout or copy needs to go. For those who love collecting and analysing data to understand how to optimise websites, Crazy Egg is one of the more popular tools for click-tracking and visualising a consumer’s behaviour.
In this post, we will explain what Crazy Egg is and why you should implement it today to get a better understanding of how a website is performing according to its users.
What Is Crazy Egg?
Crazy Egg is an online tool that studies how users are using a website. This tool looks for indicators performed by users such as where there are clicking, where they are scrolling, and how long they remain on a specific part of a webpage.
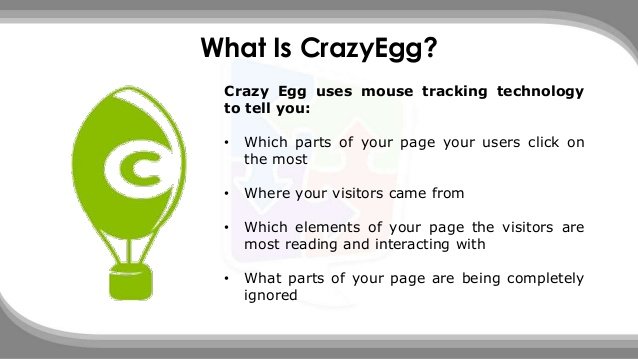
With just a small snippet of code to install on some or all pages of a website, Crazy Egg will track your visitors’ behaviour and report back on what they are, and what they aren’t responding to.
Let’s break this down a bit further. What are some of the features of Crazy Egg?
Heatmaps
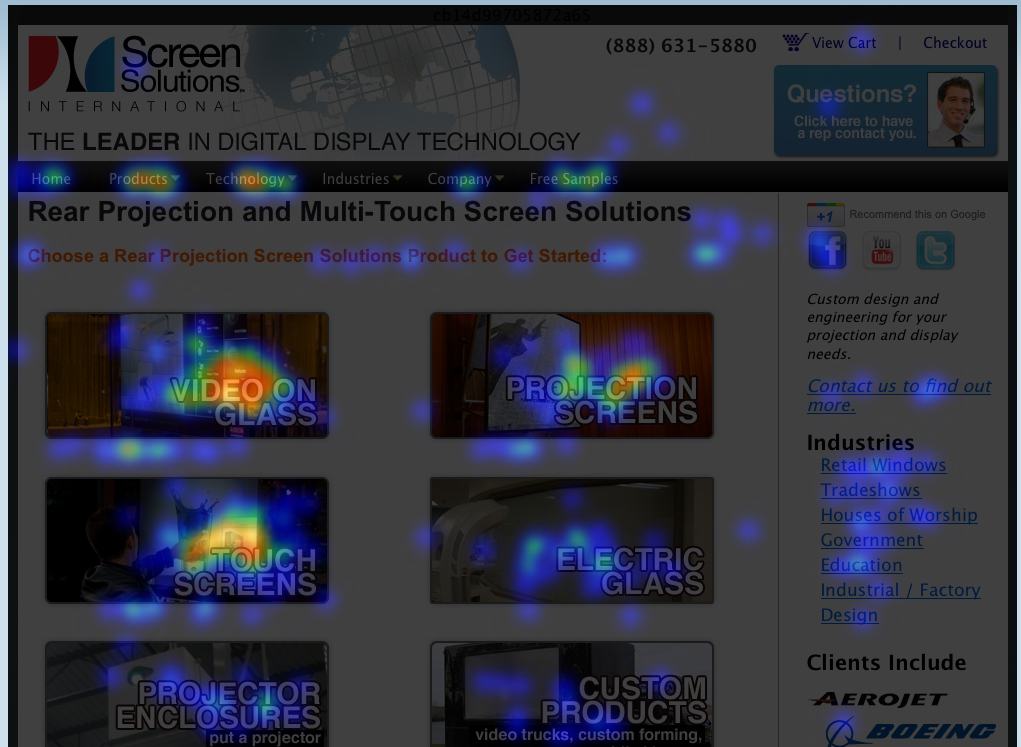
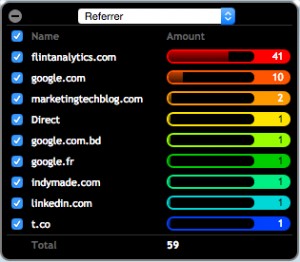
According to Crazy Egg, the Heatmap is a visual overview of where your visitors are clicking. The brighter the area, the more popular it is; the darker the area, the less popular it is. As a specific area of your page gets more clicks, the colour on the heatmap will change.
In the above example, we can see that ‘Video On Glass’ is the clear winner in terms of clicks and what category of screen solutions is generating the most heat.
Essentially what the Heatmap does is it presents a static image of the webpage being tracked and an overlay visual graph of all the clicks made by all the users tracked by the software.
Are users frequently clicking on a specific element? Have you tried to place the most-clicked items at the top of the page? Are there links or clickable elements that are being ignored? Now, because you have tested, you can take action to optimise or test new page designs, layout and CTA’s.
Scrollmaps
Like the name suggests, this feature reports where users are scrolling, and of course, where they are stopping to view a specific element.
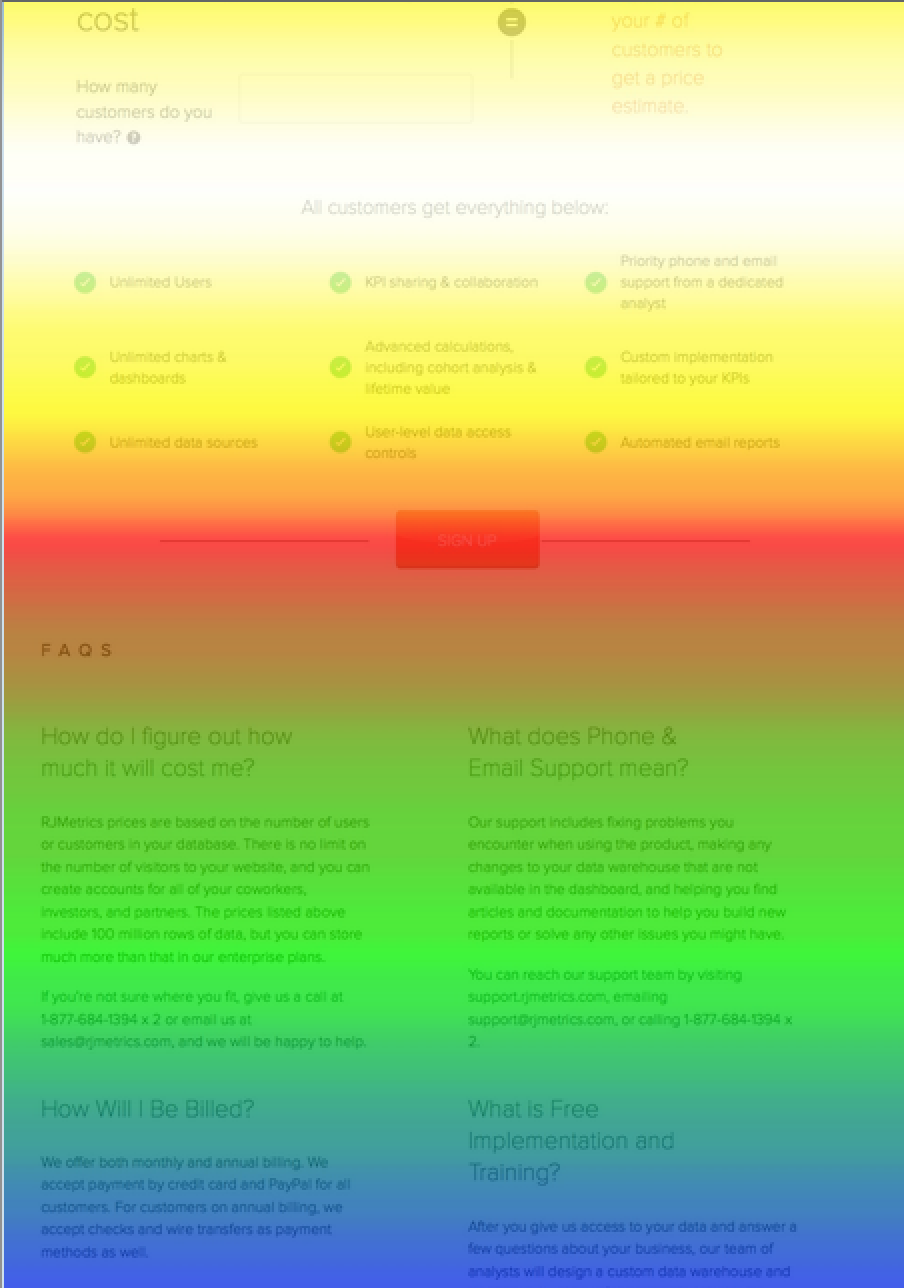
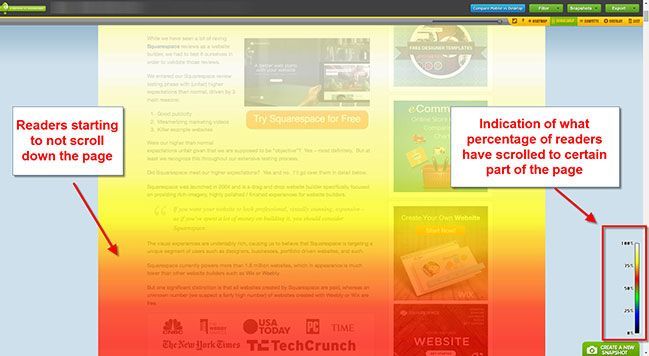
The Scrollmap shows sections of the page that have been viewed the most. The brightest sections have been viewed the most number of times and the darker sections have been viewed the least. The legend at the bottom shows the relationship between a specific colour and the percentage of impressions received.
The idea of the Scrollmap is to identify where users are spending the most amount of time on. In the above example, we can see the brightest part of the page is at the top, which means its receiving the most attention. As the page goes down, the attention is progressively reducing, as visitors are not viewing it.
How can we use this information to improve our webpage? The idea is to identify which parts of the page are receiving the most attention and moving them to the top. Likewise, if users are not viewing specific elements, this is a change to change them to make them more engaging or informative to the point where it creates interest.
Confetti
The Confetti report displays clicks on a page from your visitors and the metrics for the clicks. The colourful confetti dots each represent a click on the page. The colours change based on the selected metric in the legend.
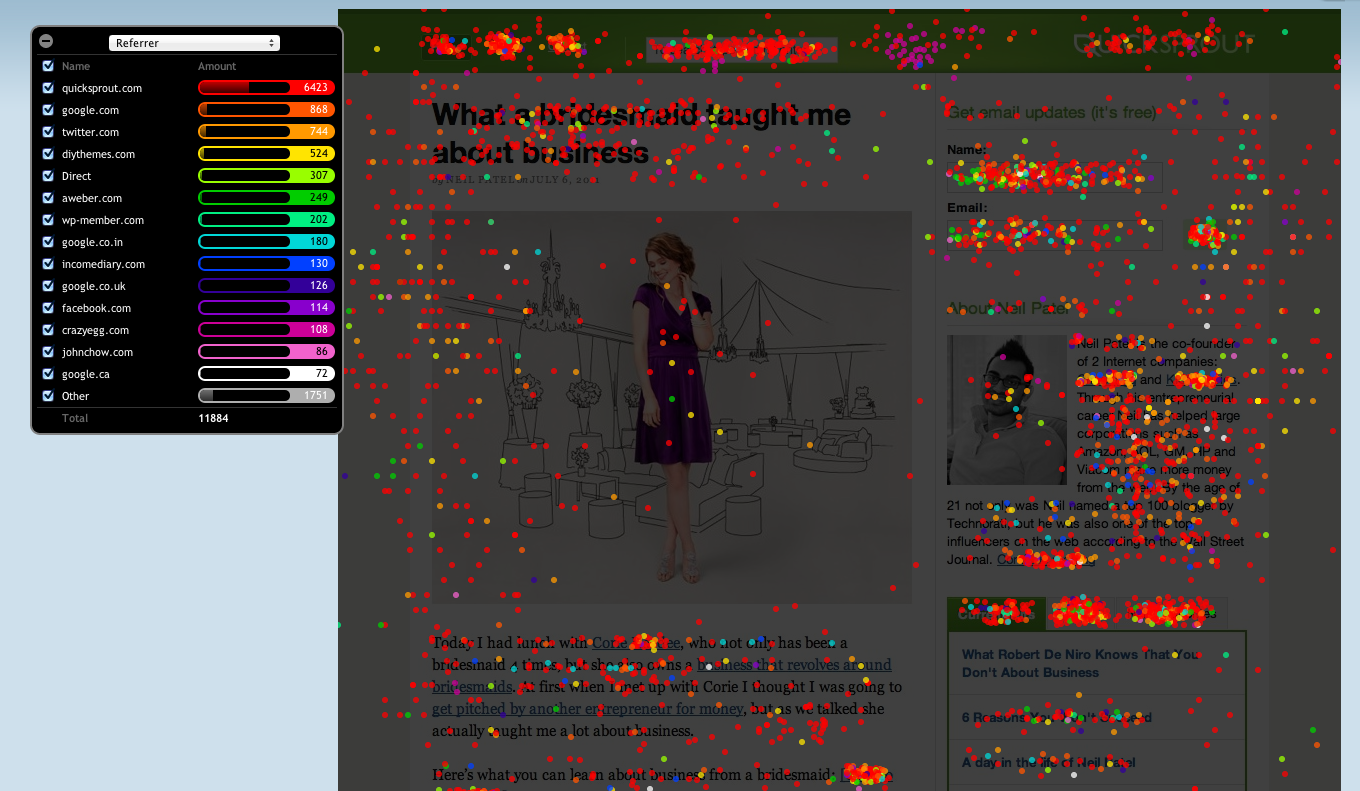
Confetti is like the Heatmap in terms of what is being clicked on, however, the confetti feature goes even further by breaking down the clicks into different segments of users.
This feature is helpful because it breaks down exactly where these clicks are coming from. With the confetti report, you will be able to distinguish all the clicks you get on your site segmented by referral sources, search terms and more.
This will highlight if visitors are using different website browsers if they’re from different countries, their operating system, device type, time of day and more.
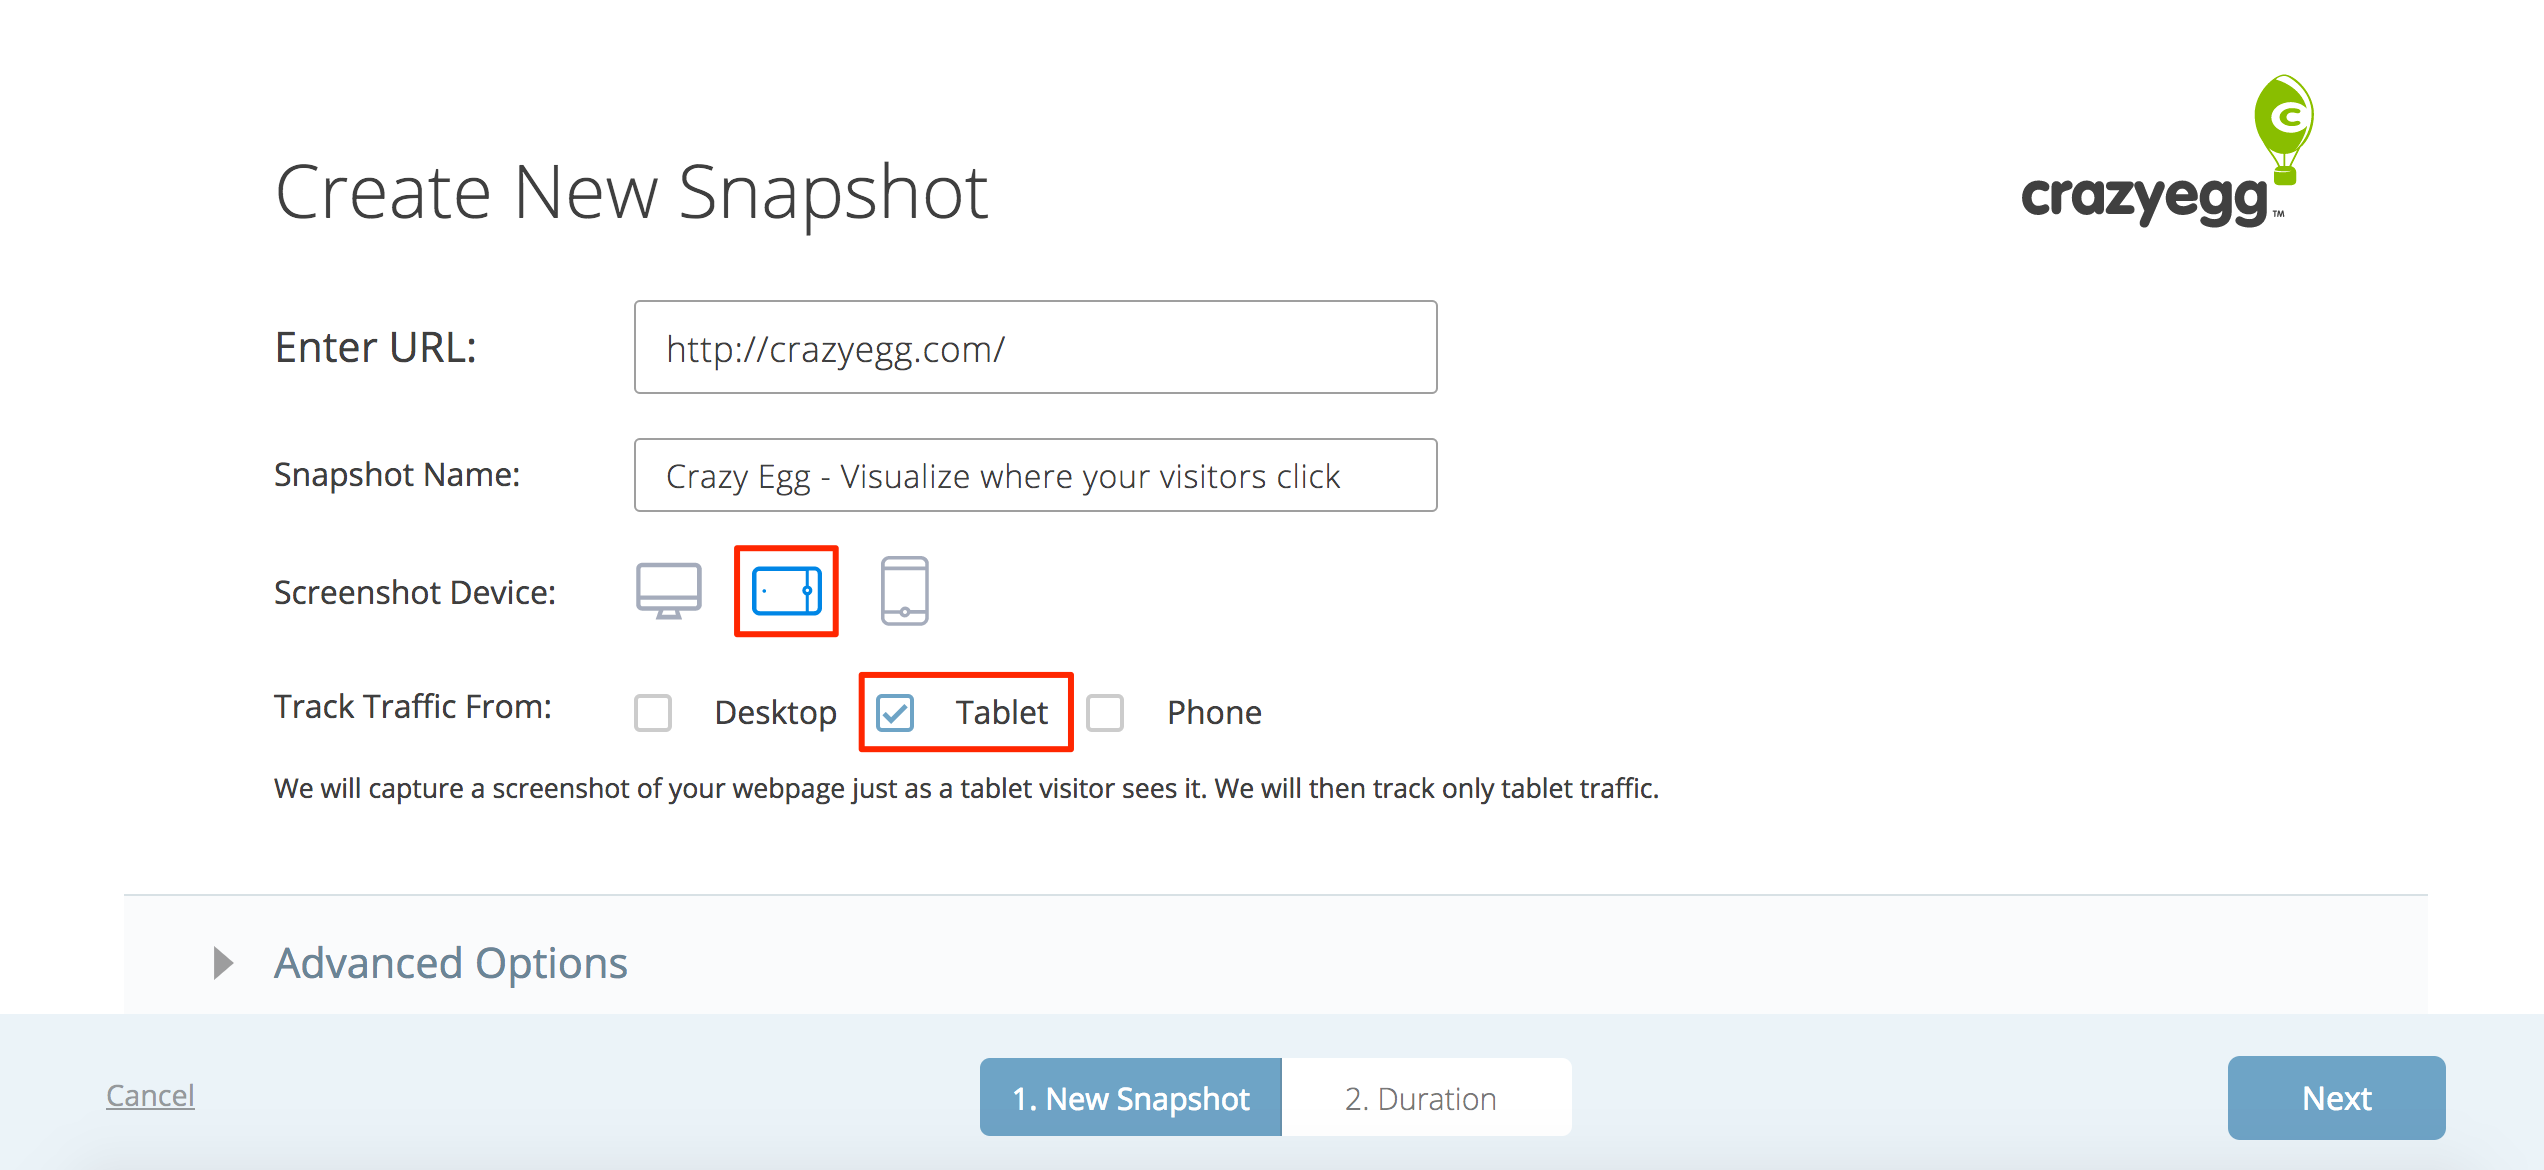
Mobile Tracking
One feature that distinguishes Crazy Egg from other web-analytics software is that it provides the ability to track data on mobile and tablet. When viewing the result, you can click “Compare Mobile vs Desktop” to see the result on mobiles.
In conclusion, understanding how your visitors behave on your site will determine what they’re interested in, and what they are ignoring or might not even see.
Failing to continually improve your website by keeping visitors interested may result in them not returning to the site again. However, testing your visors behaviours and actions for the best possible result can significantly improve your brand by encouraging them to return, share your website with others, or purchase products.
Ready to get started? Head over to Crazy Egg to begin improving your website today.