
Many marketers and agencies around the world still rely heavily on traditional static reporting. However, with the recent rise of more dynamic reporting dashboards it’s time for a shift in how reporting is conducted.
Dynamic dashboards, such as Google Data Studio, offer features that will increase your reporting efficiency, save you valuable time and keep your clients informed on a regular basis. Some of these advantages include enhanced shareability, interactivity and real-time reporting.
The Advantages of Google Data Studio
Templates
One of the most powerful features of Google Data Studio (GDS) is templates. This allows you to connect data sources with pre-existing templates, which prove to be extremely useful when dealing with multiple clients; where one primary template can be duplicated for each client.
When choosing a template, you’ll want to follow the below steps in order:
- Connect the relevant data and make sure it’s appropriately integrated
- Present the data with relevant visualisation (the best charts/tables to present the data)
- Creating a background theme that represents your agency or business (colour/logos) and provides an efficient flow of data.
GDS supports a wide range of data sources for you to integrate into your report, some of the more popular sources that are available for connection are:
- Google Analytics
- Google Search Console
- Google Ads
- YouTube Analytics
- Search Ads 360
- Display & Video 360
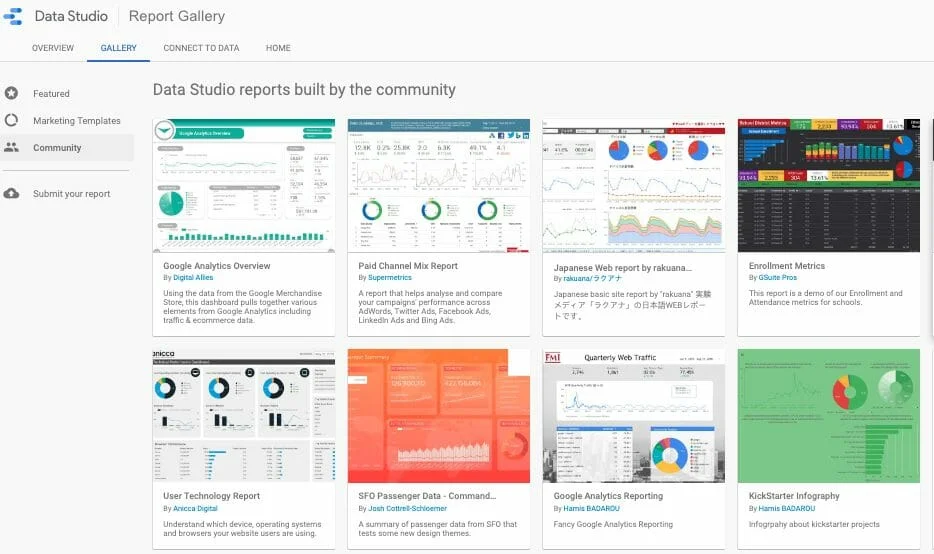
If you’re not wanting to develop your own theme from scratch, there may already be some available templates that match your needs. GDS provides access to a vast community of third-party users who develop and share templates online. These templates can be found and applied from the report gallery.
Interactivity (Filters):
The level of interactivity in GDS proves to be extremely useful when analysing reports and data. Pages can be setup to have interactive filters, so whenever a filter is applied on a page, it is applied to each individual report. For example, if you opt to filter out all traffic besides organic, the reports on that selected page would only show data for organic traffic.
To add a filter, click this icon below:

The filter will then show on the report, where you’ll be able to reposition and resize it. Once the filter has been selected, a list of data will show up on the right allowing you to add variables such as dimensions and metrics.
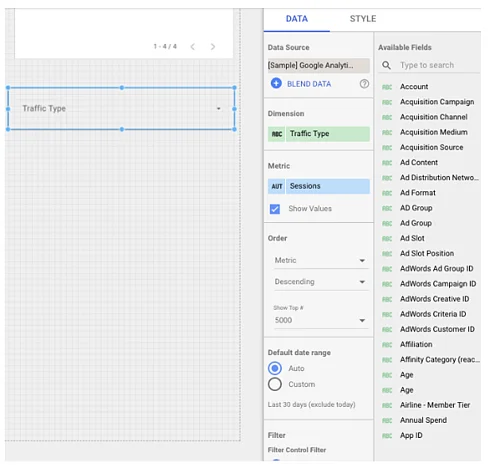
In the provided data tab, choose the dimension your audience will be able to filter the page with. These dimensions are generated from your data source, as you can see in the example below “websites” has been selected as a dimension. Allowing the viewer to filter the report with competitor websites.
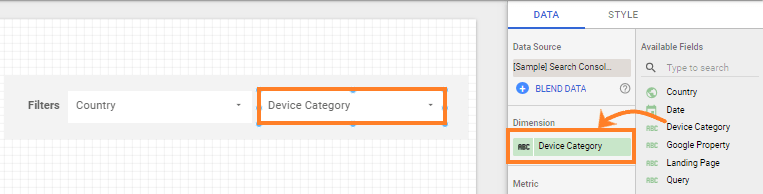
The metric section, whilst not necessary, can be applied to show your audience the values for each dimension category within the filter. It’s also possible to add additional filters to the filter control if needed.
Data Blending
Charts in GDS draw their information from a single data source by default. However, the recent introduction of data blending allows you to implement multiple data sources into one chart, this is known as a blended data source. For instance, two different Google Analytics data sources can be blended into one visualisation chart showing the performance of both your website and your mobile app. Data blending can expose important relationships between data sets, it also distinguishes the need to arrange your data in other applications first (excel for example) before implementing it into GDS.
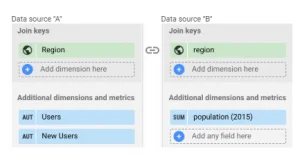
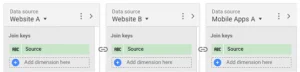
Create a blended data source by combining the records of one data source into the records of other data sources (maximum of 4). In order for the data to be combined, each source must have a ‘join key’, which is a shared set of one or more dimensions. For example, the image below contains a ‘Blend Data’ tab with 3 different data sources, with the selected ‘Join Key’ as the ‘Source’ dimension. The blended data source that will be created from these will include all the records from Website A, Website B and Mobile Apps that share the same ‘Source’ values.
Real-time Reporting:
Arguably one of the best features of GDS that makes it stand out in comparison to static reports is real-time reporting, unlike static reports which are usually generated on a monthly basis. If your marketing systems have been connected to your Data Studio, the dashboard will show real-time results of your key performance indicators (KPIs). Report dates are available to be modified on the go and still allow access to any time period you like.
Shareability
GDS can be shared to anyone via a link similar to Google Docs, whereas static reports are generally sent through email as an excel or PDF file. This means a client is kept constantly updated and has the ability to check over agency reports whenever they need to, creating more transparency between the two.
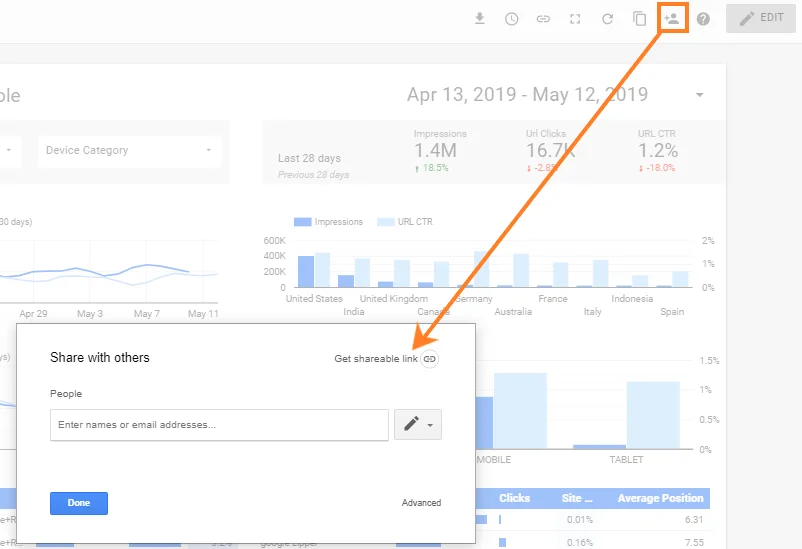
This plays a big role in giving the client a sense of authority and understanding of how well their budgets are spent. The shareable link can also contain password protection if needed to keep information confidential for both the client and the agency purposes.
There is also an option to send out reports on a recurring basis. This is known as the “scheduled reports” feature and can be found by clicking the clock in the primary menu:
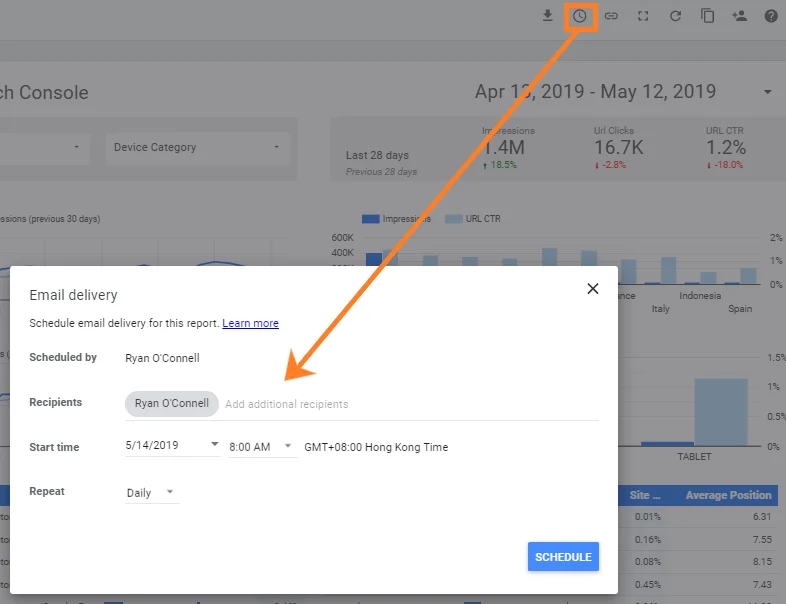
If you’re not wanting to allow your clients access to live reporting, this may be a better option which will give you more time to prepare and polish reports.
Conclusion
Many agencies still rely primarily on static reporting with programs like Excel, which certainly has flexibilities when it comes to calculating data, but GDS provides a number of beneficial features that certainly outweigh basic static reporting. However, there are still a few limitations of GDS when compared to other business reporting tools.
For example, blending data from multiple sources needs improvement, which could be achieved through having a dedicated space in the dataset tab so you can save, reuse or manage blended datasets like any other dataset available. The GDS content management can also prove to be quite slow at times and content handling could be made a lot smoother.
Despite this, GDS is easily still the most efficient tool in the market for digital marketing reporting purposes and these are minor issues that will likely be solved over time.