
By Kelvin Sim
Introduction
Conversions are a very important factor in any type of marketing strategy. As we have previously mentioned in our recent blog post – How To Conduct Effective Conversion Rate Optimisation To Grow Your Business, your conversion rate optimisation (CRO) activities should align with each stage of the marketing funnel. If one stage of the funnel is optimised, more prospects trickle down to the next stage, and this process continues. As such, everything about your website should be geared towards optimising your conversion rate.
Now to help you make more informed CRO decisions we suggest using a website analytics tool, better yet, a FREE website analytics tool such as Google Analytics (GA).
What Is GA?
GA is a free website analytics service offered by Google that provides you with insights into how users find and navigate your website. With its robust web analytics and reporting tools GA provides data that will help improve your website’s content, elevate user experiences and increase your conversions.
In the next section we share 3 standard GA reports that can help you improve your conversions.

3 Standard GA Reports To Help Improve Your Conversions.
Whether you run an Ecommerce store and want to better understand your audience to increase sales, or if you own a small media business where your main objective is having users subscribe to your monthly newsletter, GA can provide you with everything you need to understand your website traffic.
Here are 3 standard GA reports that can help improve your conversions.
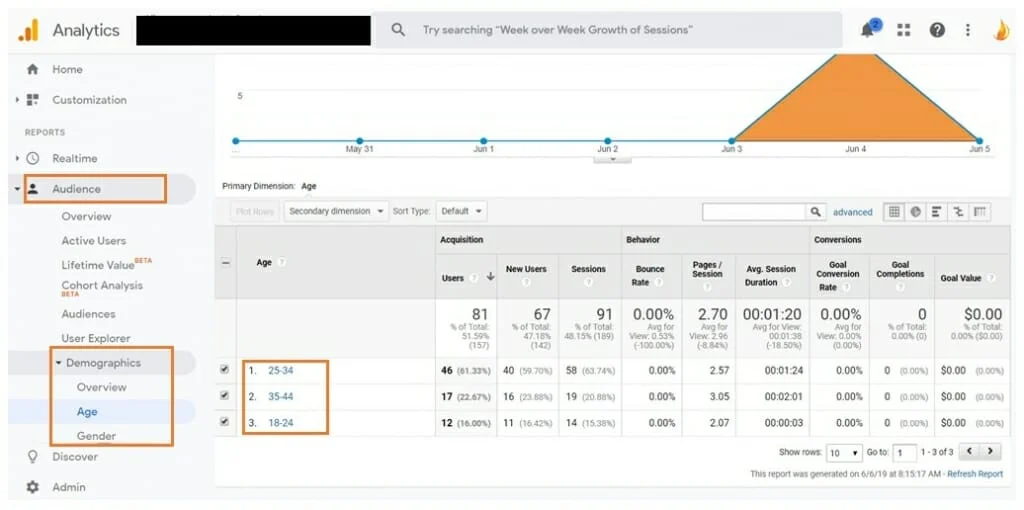
1. Audience Report
GA’s Audience report provides insight into the characteristics of your users. There are typically 6 different attributes to the audience report and they are:
- Demographics: The age and gender makeup of your website audience.
- Interests: User behaviours segmented by affinity and marketing categories.
- Geo: The languages and locations of your website audience.
- Behaviour: Comparisons of new and returning visitors, how often return visits occur and how long visitors spend on your site.
- Technology: The browsers, operating systems and networks of your website visitors
- Mobile: A breakdown of devices used to access your website.
By review each attribute you will be able to identify the ‘who’, ‘where’, ‘what’ and ‘how’ of your visitors.
For example, if a specific product landing page on your Ecommerce store receives high-levels of traffic, you will be able to identify from the pool of visitors their gender and age in the Demographic attribute of the Audience report.
Furthermore, if you wanted to understand where your visitors are coming from, you will be able to segment your data into countries, states and towns.
Thus, allowing you to revise your product landing page’s content to a specific gender and age, as well as gain a better understand of the geographic parameters if you deploy any paid campaigns for this specific product.
By segmenting your Audience report, you will be able to make adjustments to your website to attract people that are most likely to convert.
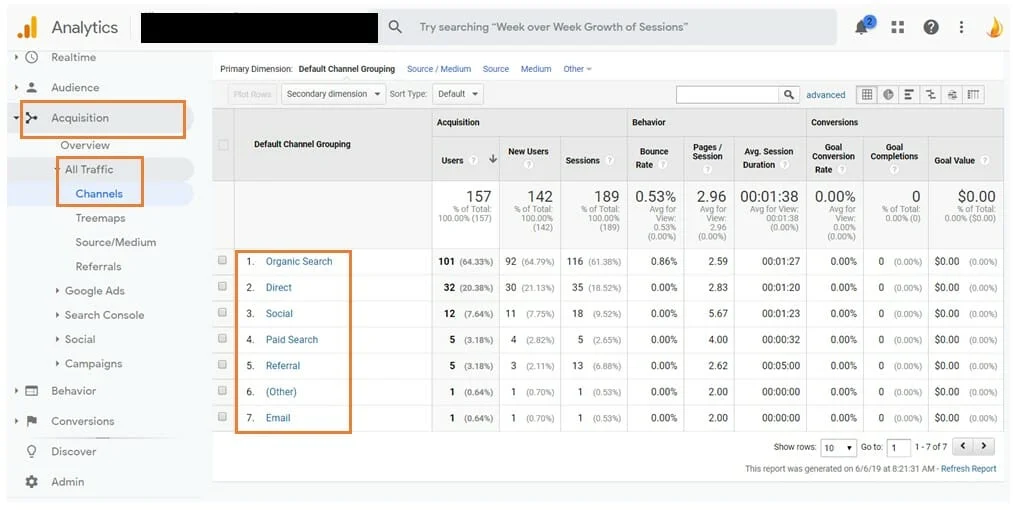
2. Channel Report
Channels in GA are high-level categories that indicate how people found your website. There are typically 8 different channels of traffic and they are:
- Direct: indicates visits where users navigated directly to the URL or the source of the visit is unknown
- Organic: Indicates visits from organic (unpaid) search results
- Social: Indicates visits from social networks (Facebook, Twitter, etc.)
- Email: Indicates traffic from links clicked in email messages, whether mass email marketing or individual messages
- Referral: Indicates traffic where users clicked a link from another site, excluding major search engines
- Paid: Indicates traffic from PPC campaigns run in search results
- Display: Indicates traffic from display advertising, such as Google AdWords remarketing campaigns
- Other: Indicates traffic from online advertising outside of search and display, such as cost-per-view video advertising
By segmenting your Channel report, you can identify differences in the level of traffic and understand which marketing efforts are performing better than others.
For example, if you are currently running a social media ad campaign for your Ecommerce store, you will be able to identify the number users that visit your website via the social channel.
Furthermore, if you are running a Google Ads campaign simultaneously, you will be able to identify the difference in the level of traffic these two campaigns are producing.
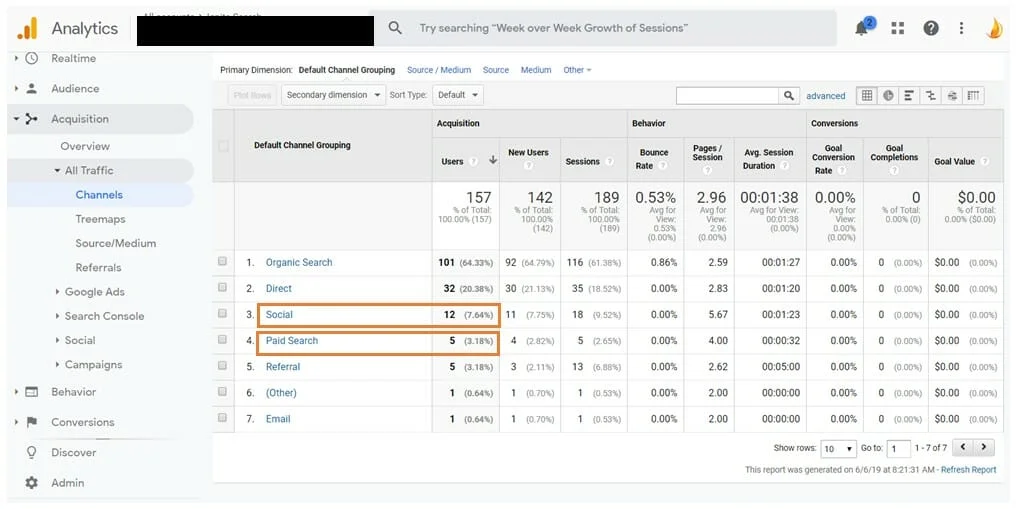
Thus, allowing you to revaluate and make adjustments to your marketing campaigns that will provide you with the best return of investment (ROI) and ultimately improve your conversions.
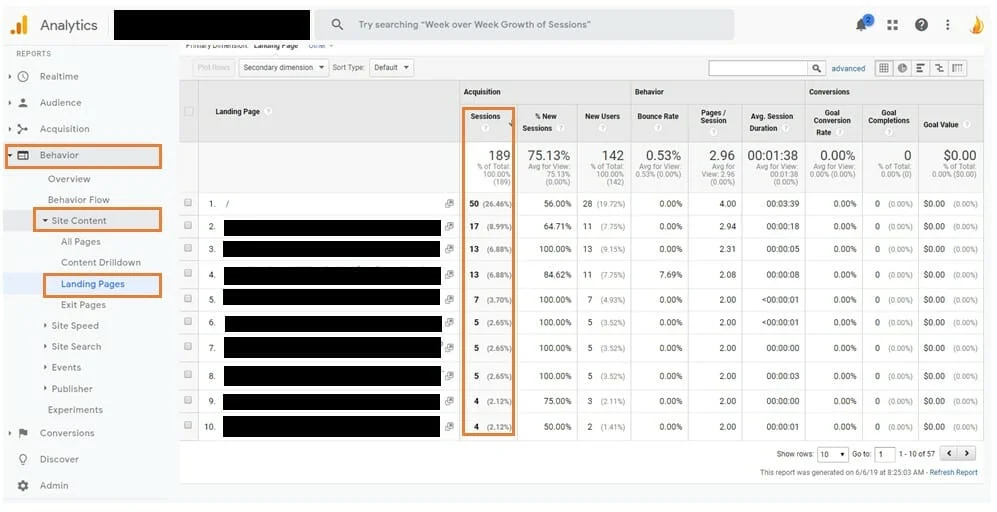
3. Landing Page Report
The Landing Page report in GA will help you understand what your visitors are most engaged with on your website. The data, by default, includes:
- Total Sessions: A single visit to your website, consisting of one or more pageviews, along with events, Ecommerce transactions and other interactions.
- Bounce Rate: The percentage of sessions with a single pageview.
- Pages Visited Per Session: The total number of pages people visited on your website.
- Average Session Duration: The sums the duration of each session during the date range you specify and divides that sum by the total number of sessions.
- Conversions Goals: Specific user interactions on your site.
For example, if your Ecommerce store is running an End of Financial Year (EOFY) sale on all product listings, you will be able to identify which product landing pages receives the most sessions.
Furthermore, if a specific product landing page receives a high number of sessions in a specified data range as well as a high bounce rate, you will be able to pair these two metrics to gain a more accurate understanding of this landing page’s performance.
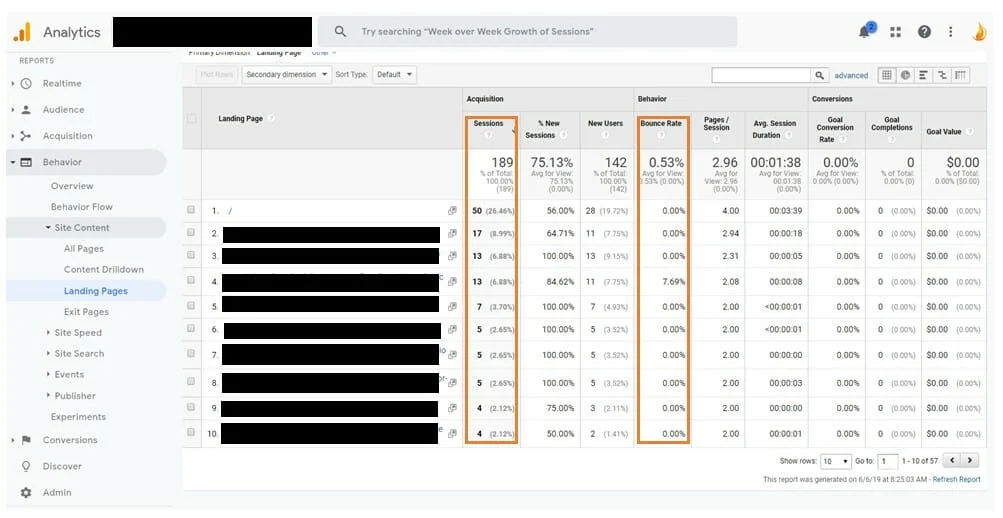
By highlighting pages that have high traffic levels as well as high bounce rates, you can gain information that will help you to review the User Experience (UX) Design of the webpage and see if you can make improvements that can keep your visitors on the site.
Conclusion
In order to increase conversions on your website, it’s important to have a full understanding of who your visitors are, where they’re coming from, and what they do once they arrive on your site. By examining the reports above, you’ll be able to make informed decisions about your CRO activities that will improve your conversion rates and ultimately grow your business.